A new report designed to help inform early childhood strategic planning at the state and regional levels offers a view of the total investments being made for Arizona’s youngest children.
Read On Arizona’s interactive fiscal map looks at the early childhood funding landscape over 3 years and answers these questions: Who (level of government) invests how much (appropriated/obligated amount of money) and in what (specific age groups, types of services, programs)?
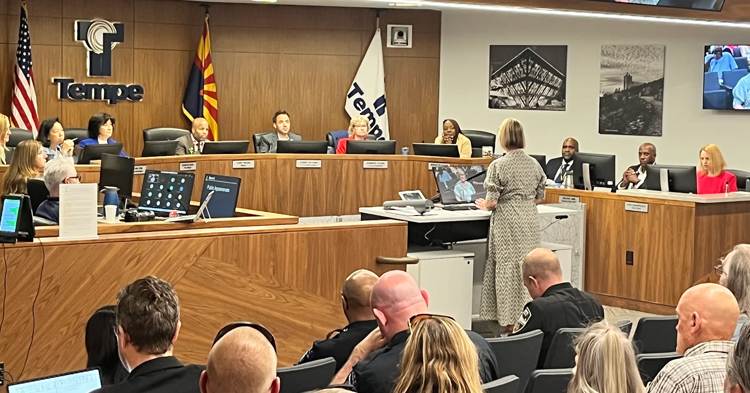
Lori Masseur from Read On Arizona presented the fiscal map at the First Things First state Board meeting in April.
“It creates a child-centered or family-centered way of looking at early childhood funding streams,” Masseur said.
The interactive map allows policymakers, partners and stakeholders in Arizona’s early childhood system to visualize and analyze the 66 funding streams that supported early education, child care, and other services for children and families from 2019-2021. This includes the impact of federal relief dollars and makes clear the imbalance of federal and state funding.
This child-centered approach is different from a department-centered approach because instead of looking at each agency individually, for example, what is FTF’s budget and what it spends on child care supports — this approach looks at the totality of all the agencies’ budgets, Masseur said.
“So we’re able to answer the question, ‘How much are we investing in child services?’ not how much is one agency investing in child services,” she said.
Looking at the fiscal map, the report shows that 84% of Arizona’s early childhood funding is from federal sources, while 15% is from state funding, with the majority of that funding coming from FTF. The percentage breakdown is on par with other states in a cohort that participated in this research. But the overall amount that Arizona spends compared to Connecticut, Massachusetts, New Mexico and Texas is significantly less. Arizona spends about $1,200 per child while the other states spend about $6,000 per child.
“One opportunity with this tool is to also inform what our potential ask is for investments for children birth to age 5,” said FTF CEO Melinda Morrison Gulick. “Now we understand what is available. Are we maximizing those funding streams?”
Masseur agreed. The fiscal map provides a price tag and the ability to coordinate supports and services in a more streamlined approach.
The state fiscal map is the first step in a three-year engagement between Children’s Funding Project and Read On Arizona to create a strategic public financing plan the state can use to determine how to best fund early childhood priorities. It includes funding streams that support early care and education as well as other necessary services and supports for children birth to age 5 and their families, such as physical, mental and behavioral health services, and family and community services. However, it does not include parent contribution, Medicaid, TANF, SNAP and per pupil education funding.
According to the report, it is critical timing to examine the impact of increased federal funding in response to the pandemic, especially on early care and education and other safety net programs. For fiscal years 2020 and 2021, federal COVID-19 relief funding data was included in the map and can be analyzed for its impact on early childhood funding.